Aug. 6 Watershed Council Meeting and Tour.
The next Watershed Council meeting will take place on Thursday, August 6, 2015, from 9:00 am to noon.
The meeting will be held at the City of Ventura’s “VenturaWaterPure” direct potable reuse demonstration plant at their wastewater treatment facility located adjacent to the Santa Clara River estuary, 1400 Spinnaker Drive, Ventura. A presentation and tour of the plant will take place from 9:00 to 10:45 am, and the regular meeting will follow until 12:00 pm. The City is seeking public input on this potential new source of water supply.
At the meeting we will also get a presentation from Ed Bennett, Thacher School facilities director, on Thacher’s onsite wastewater treatment facility. We will get an update on Sustainable Groundwater Management Act implementation, and continue the discussion about the Council’s staffing and funding for next fiscal year.
Meeting agenda.
Memo to Council regarding the watershed coordinator funding/staffing agenda item.
Note: If you’d like to see the demonstration facility but can’t make the meeting, the City is offering tours every Saturday morning from 9:00 – 11:00 am. Sign up for the public tours before noon on the Friday before the tour by emailing gdorrington@venturawater.net or calling 805/677-4131. More info: www.cityofventura.net/water/sustainable-water
Aug. 8 Free Rainwater Capture and Graywater Workshop
Casitas Municipal Water District will host a free Rainwater Capture and Graywater workshop on Saturday, August 8, 2015. The workshop will be held at Oak View Park & Resource Center, 555 Mahoney Avenue, Oak View.
RSVP for the workshop to Ron Merckling at 805/649-2251 x 118 or rmerckling@casitaswater.com.
Stream Team Data Report, 2014 – Now Available
 Santa Barbara Channelkeeper’s Ventura River Stream Team Data Report for 2014 is now available on their website. The Stream Team has been collecting monthly water quality data throughout the watershed since 2001.
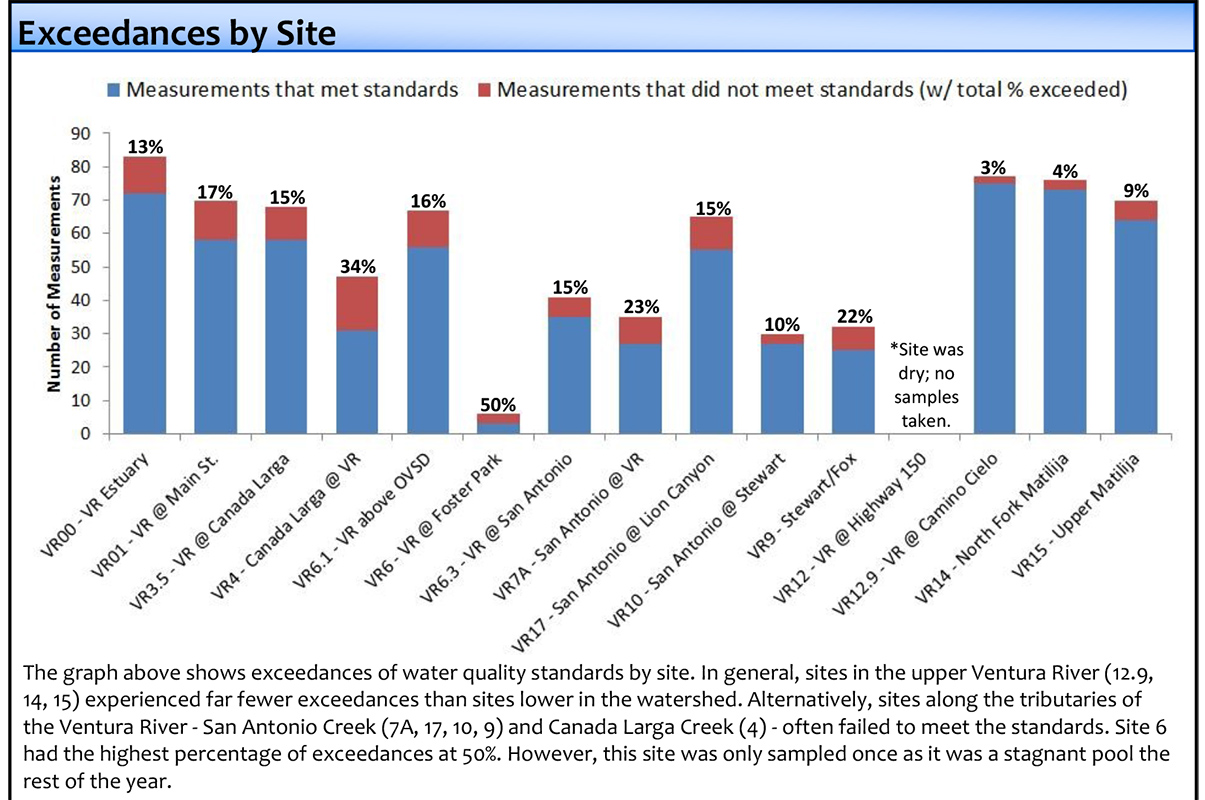
The 4-page report summarizes their water quality data and findings from October 2013 through September 2014 and compares the data to water quality standards. Information is conveyed in easy-to-understand charts and graphics.
From the report:
“In 2014, a higher percentage of samples failed to meet water quality standards than in the history of our Stream Team Program. This increase is primarily due to more frequent exceedances of dissolved oxygen, E. coli, and Total Coliform.”
Ventura River Watershed Document Library – Now Online
The Ventura River Watershed Council’s Document Library – which contains over 550 documents related to the Ventura River watershed – is now available to you and the general public. The library includes plans, annual reports, studies, permits, letters/memos, articles, brochures, policies, guidelines, and lawsuit-related documents.
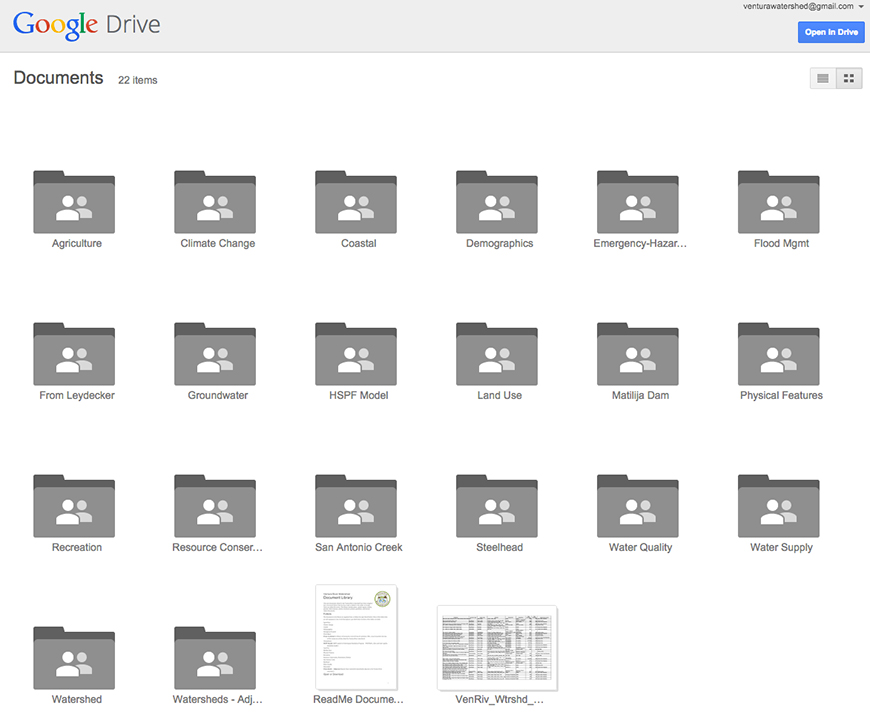
The “Watershed Documents & Presentations” page on the Council’s website (under “Data”) now includes a link to the library, which is stored on Google Drive (an online file server). You will find that this page (pictured above) contains three things: 1) 20 folders of documents, 2) an Excel spreadsheet inventory of all of the documents, and 3) a ReadMe file that explains how to open and download documents, and how to use the spreadsheet. Reading the ReadMe document is highly recommended if you are not familiar with the Google Drive interface.
Similarly, the “Watershed Documents & Presentations” page contains a link to another Google Drive page where watershed-related presentations are available for download.
Feel free to link to the Council’s “Watershed Documents & Presentations” page from your own website, and call or email me if you have questions about how to access the documents.
Santa Barbara Channelkeeper’s Data Portal
Since 2014, Santa Barbara Channelkeeper’s website has made their water quality data available to the public via an interactive data portal on their website.
The portal offers the option of downloading the entire data set for the watershed in an Excel file, or retrieving data for specific monitoring locations – complete with charts summarizing trends for each parameter tested. It is quite a sophisticated platform.
Graphs show data by sampling site for dissolved oxygen, conductivity, pH, temperature, turbidity, nutrients, and bacteria. Users can also see the percentage of samples that did not meet water quality standards.