Statewide Emergency Mandatory Cutbacks.
On April 1, 2015 the Governor issued an Executive Order (B-29-15) outlining actions needed to respond to the severe drought in California, including - for the first time in California history - state requirements for mandatory cut-backs. The order outlines restrictions intended to achieve a statewide 25% reduction in potable urban water usage (compared to 2013) through February, 2016.
Emergency Regulations (schedule, documents, etc.): State Water Board Drought Year Water Actions website
Drought Breaking News: Department of Water Resources Drought Information website
Watershed Conditions
Lake Casitas Water Level Monitored daily.
Upper Ventura River Groundwater Basin Level Monthly report by Ventura River Water District (scroll to bottom of page, on left).
Annual Rainfall To Date Automated daily report. Note: "Normal" in this report is based upon the 35-year base period of 1957-1992. Includes monthly summaries by station.
Monthly Water Conservation Data (June 2014 – Feb 2015) The state requires large urban water suppliers to report on their urban water production monthly. This report is an excerpt of the data for Ventura River watershed’s three large urban water suppliers: Casitas Municipal Water District, Ventura Water, and Golden State Water Company–Ojai. (Note: agricultural water demand is not included in these reports.) Complete (statewide) reports can be found at the State Water Resources Control Board's Conservation Reporting website.
National Climate Predictions
 * 2015 data is still preliminary. Source: Ventura County Watershed Protection District, www.vcwatershed.net/hydrodata/
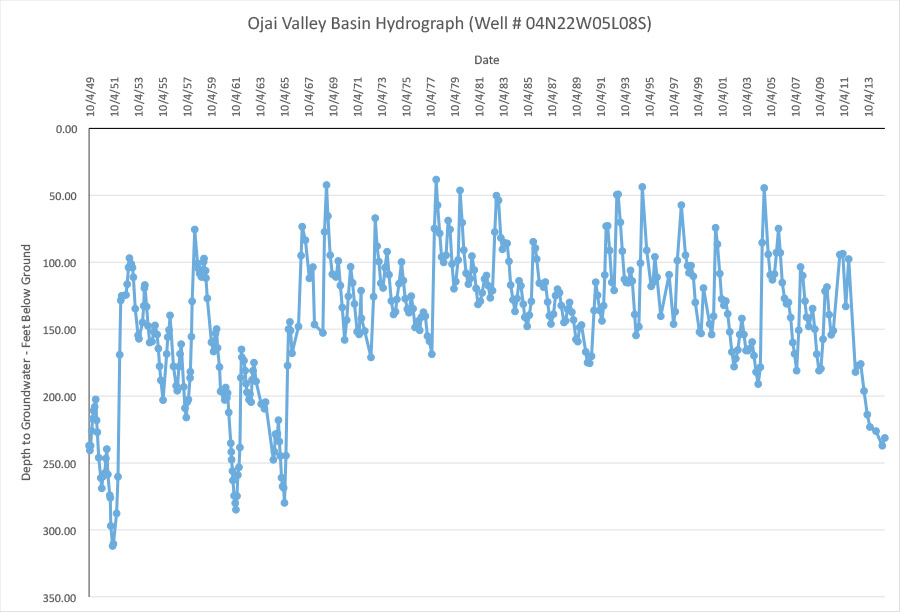
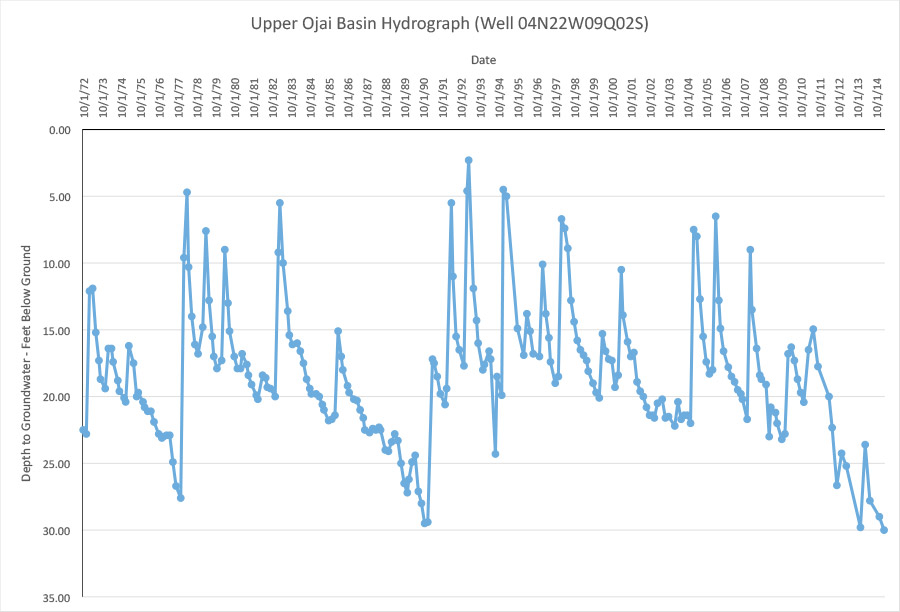
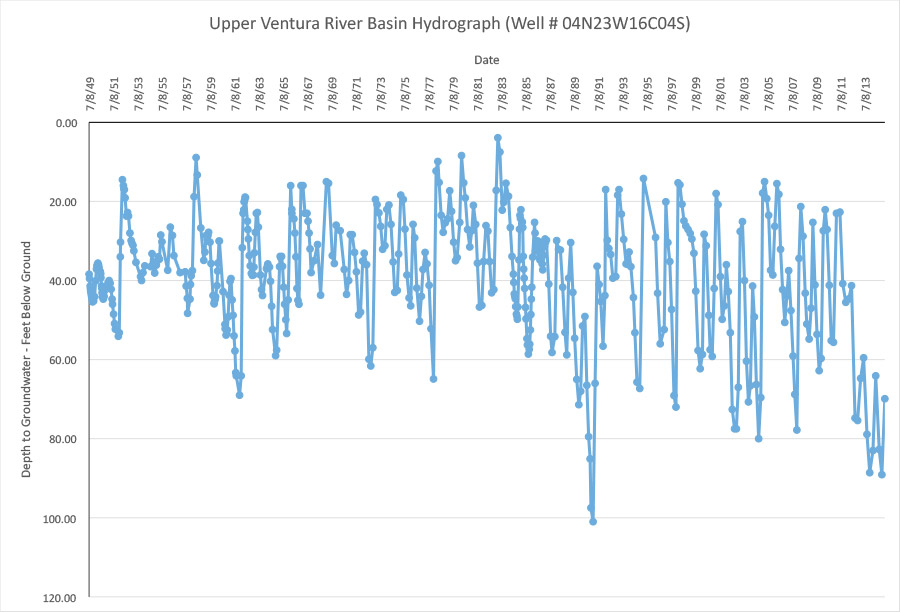
Groundwater Levels thru March 2015
Groundwater levels are monitored quarterly in key wells in the watershed's groundwater basins. (The Lower Ventura River Groundwater Basin is not included below as it is relied upon less and has less consistent monitoring data.) See Section 3.3.3 Groundwater Hydrology in the watershed management plan for more information on groundwater basins in the watershed, including how they respond to rain. Click on the graph for a pdf. Data from Ventura County Watershed Protection District.
Ojai Valley Basin
Upper Ojai Basin
Upper Ventura River Basin
Wet and Dry Cycles in the Ventura River Watershed
The Ventura River watershed has long experienced cycles of wetter years and drier years. The storage capacity of Lake Casitas was designed by the Bureau of Reclamation based upon the longest dry period on record, the years 1944/45 to ’65.
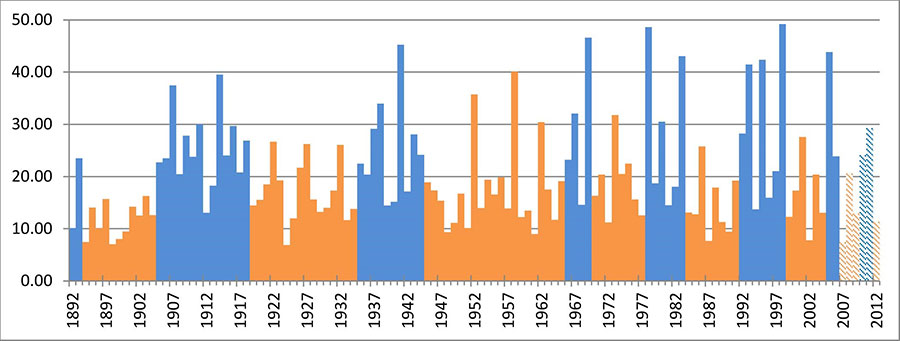 Wet (blue) and Dry (orange) Periods in the Ventura River Watershed
Source: Ventura River Watershed Management Plan
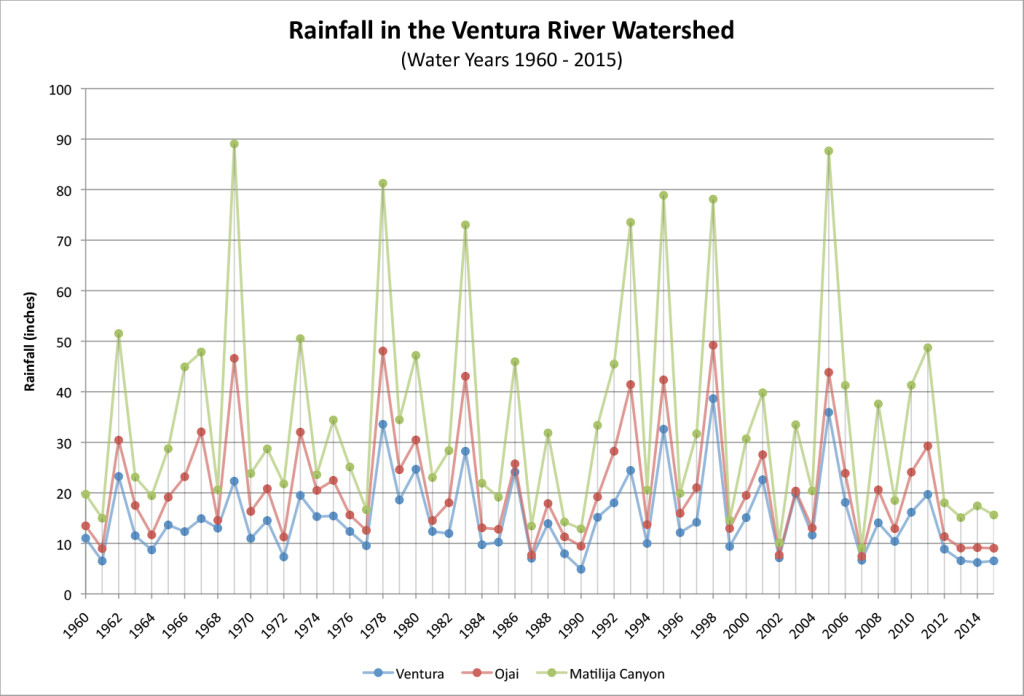
Rainfall
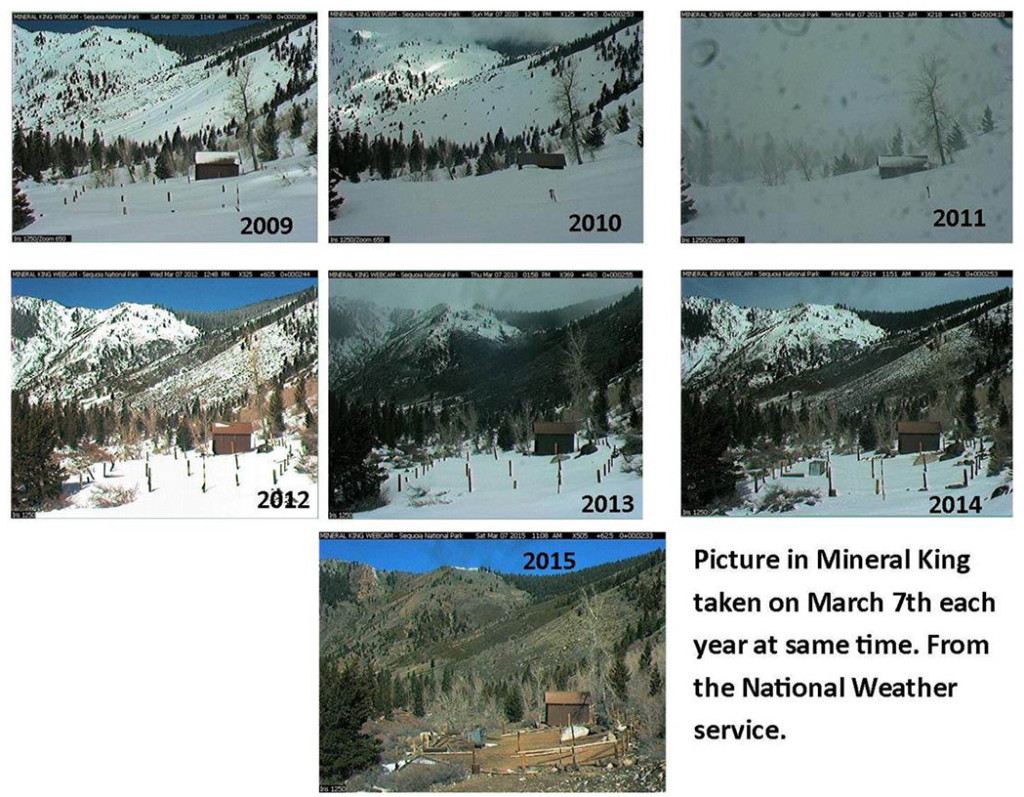
 Rainfall is highly variable in the watershed—seasonally, and from year to year. Rainfall typically occurs in just a few significant storms each year, which can come any time between October 15 and April 1, with 90% of the rainfall occurring between November and April. Snowfall is generally minimal and short-lived.
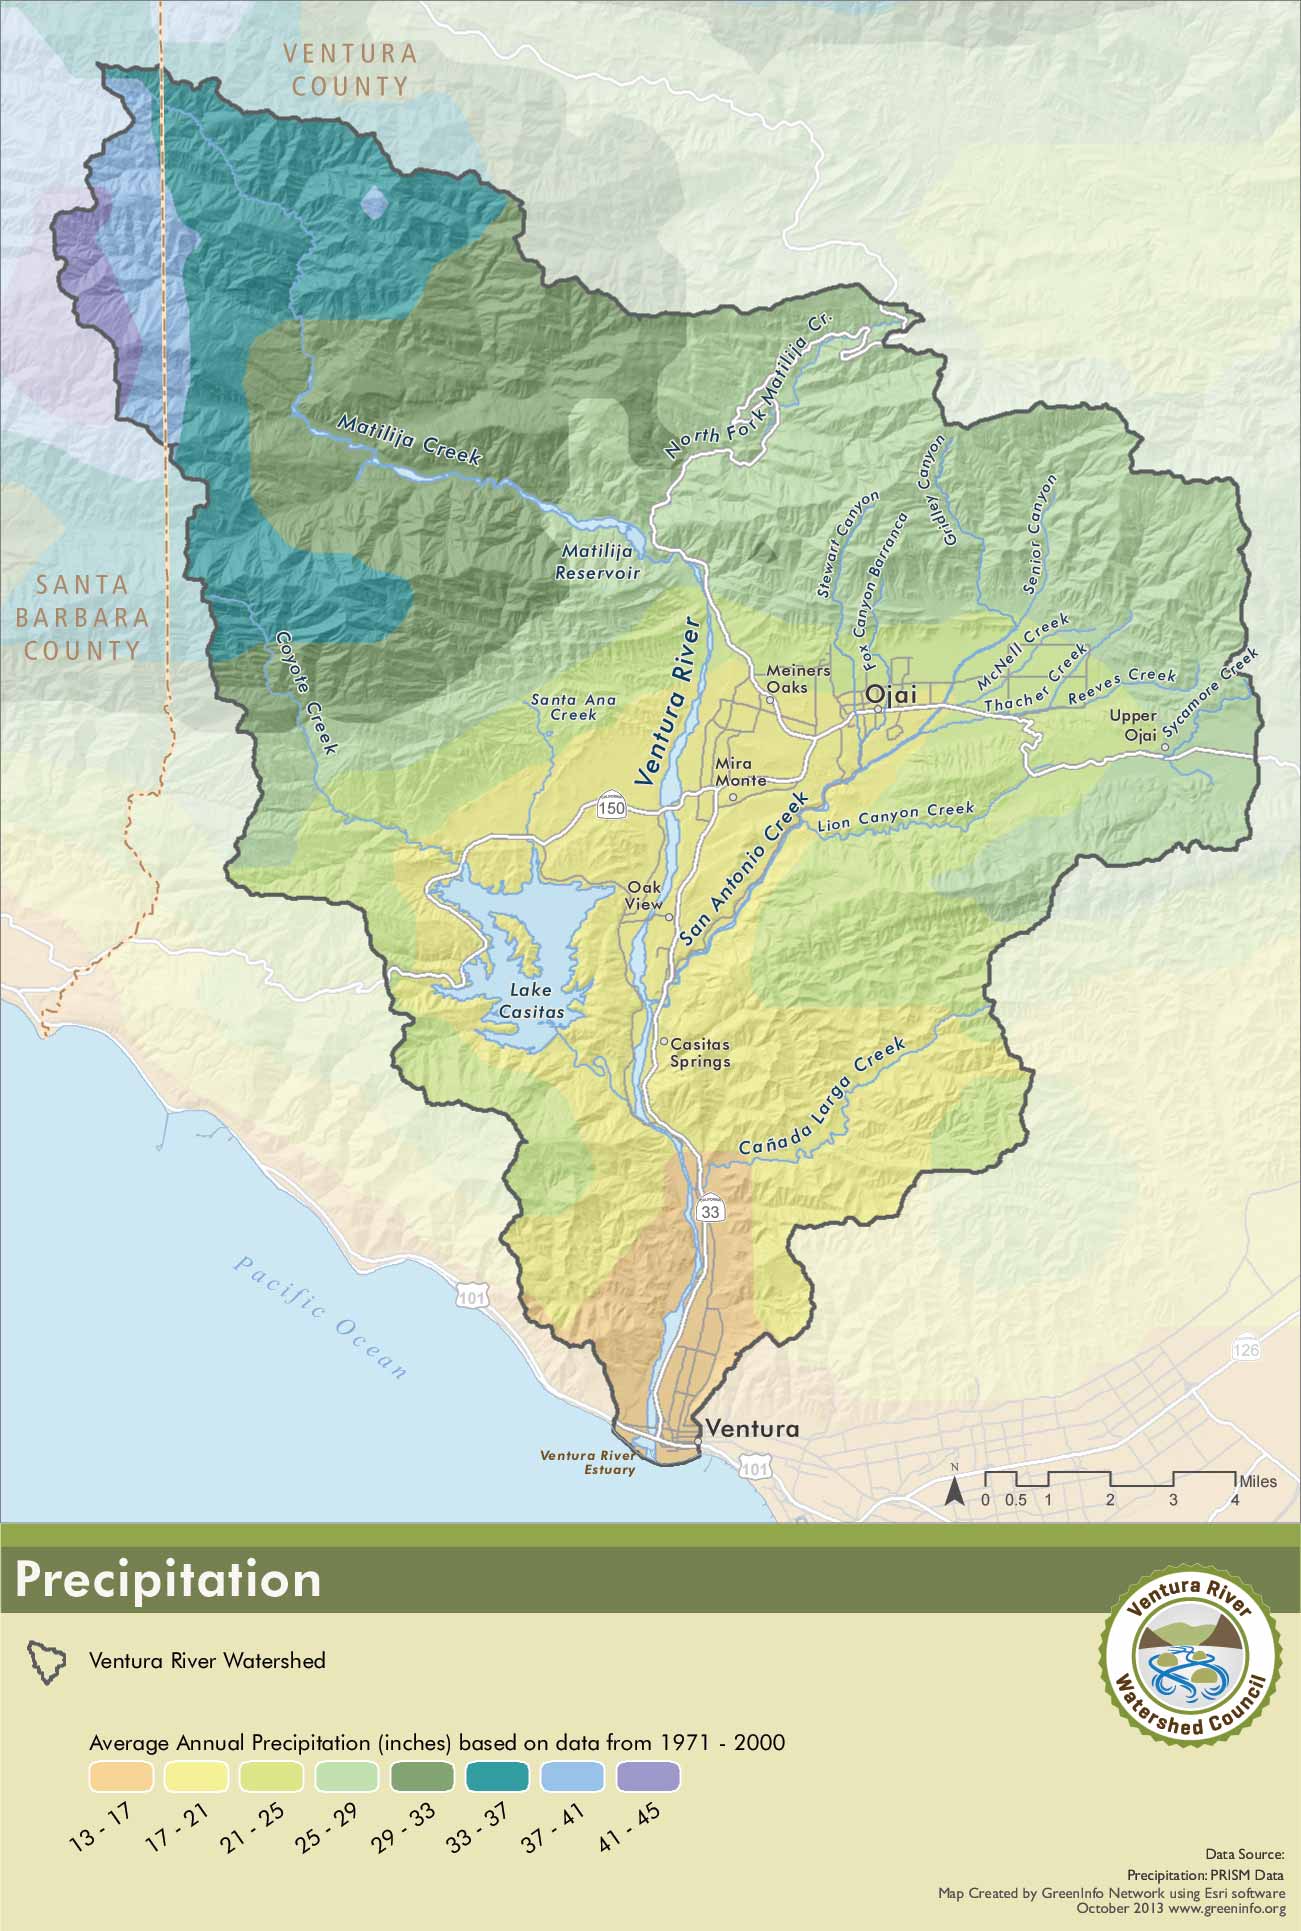
The Ventura River watershed’s rainfall patterns vary geographically. The rainfall totals from the watershed’s three climate zones shown in the table below illustrate that, on average, the watershed’s upper areas receive over twice as much rainfall, almost 20 inches more, as its lower areas.
| Rainfall Average and Median (inches/year) | ||||||
| Station # | Water Years | Average | Median | Min | Max | |
| Matilija Canyon | 207 | 1960-2012 | 35.17 | 28.74 | 28.74 | 89.05 |
| Downtown Ojai | 30 | 1906-2012 | 21.31 | 19.20 | 6.88 | 49.20 |
| Downtown Ventura | 66 | 1873-2012 | 15.46 | 14.12 | 4.62 | 38.65 |
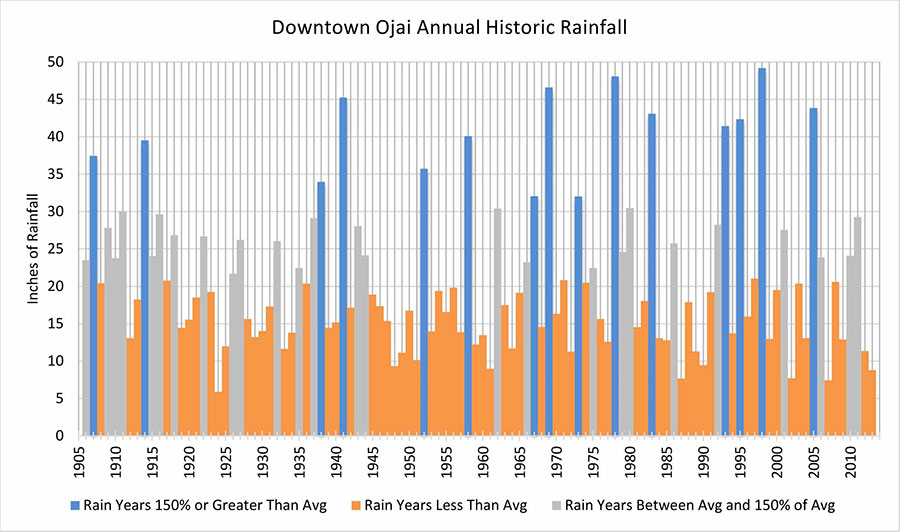
Ojai’s Historical Rainfall
Since 1906, annual rainfall in downtown Ojai has ranged from a low of 6.88 inches in 1924 to a high of 49.20 inches in 1998—a sevenfold variation. Average rainfall over this period was 21.33 inches. Since 1906, 67% of the years have had less than average rainfall in downtown Ojai. In this period, there have been 15 years of significantly high rainfall in downtown Ojai. (Significantly high rainfall years being defined as those having rainfall at least 150% above the average—or greater than 32 inches.)
As variable as its rainfall may be, the Ventura River watershed does have the distinction of receiving more rainfall than other watersheds in Ventura County. In 2005, 97 inches of rainfall was recorded on the Murrieta divide above Matilija Creek. The peak historic rainfall intensity was approximately 4.04 inches per hour measured during a 15-minute period at the Wheeler Gorge gauge in the mountains adjacent to Ojai.